Debugging and Performance DevTools for Frontend Apps
Essential developer tools for debugging and performance optimization
Debugging and Performance DevTools for React/Frontend
1. React DevTools
-
What it does
- Inspect the component tree in React apps.
- View props, state, and affected hooks of each component.
- Identify re-render counts and causes of re-renders.
-
Profiler tab
- Record and visualize rendering performance over time.
- Useful to spot components that take unusually long to render.
-
When to use
- Debugging questions like: “Why does this component keep re-rendering?”
import { Profiler } from 'react';

function App() {
  const handleProfile = (id, phase, actualDuration) => {
    console.log(`${id} ${phase} took ${actualDuration}ms`);
  };

  return (
    <Profiler id="TaskList" onRender={handleProfile}>
      <TaskList />
    </Profiler>
  );
}
- Wrapping a component with
Profilermirrors the DevTools Profiler output, making it easier to reproduce spikes you see in traces.
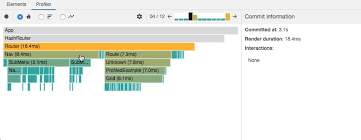 Figure: React DevTools profiler flamegraph visualizing commit cost per component.
2. Lighthouse
-
What it does
- Provides a page-level performance report.
- Measures Core Web Vitals (LCP, CLS, INP) plus Accessibility, SEO, Best Practices.
-
When to use
- Before deployment, to check overall page quality scores.
-
Relation
- Overlaps with Chrome DevTools Performance panel, but Lighthouse automates auditing and gives a summarized scorecard.
3. Web Vitals (Runtime Metrics)
-
What it does
- Collects real-user experience metrics like LCP (Largest Contentful Paint), CLS (Cumulative Layout Shift), INP (Interaction to Next Paint).
-
When to use
- In production, to measure actual user experience, not just lab conditions.
4. Bundle Analyzers
- Tools:
webpack-bundle-analyzer,rollup-plugin-visualizer,vite-plugin-visualizer. -
What it does
- Visualizes the composition and size of final JavaScript bundles.
- Identifies heavy libraries, duplicate dependencies, and unused code.
-
When to use
- Investigating: “Why is my bundle 2 MB? Which dependency is the biggest?”
-
Relation
- Unlike React Profiler (runtime rendering), bundle analyzers focus on build-time size optimization.
5. Network Panel (Chrome DevTools)
-
What it does
- Shows requests/responses, caching details (HIT/MISS), prefetch/preload behavior.
- Allows validation of lazy loading strategies for images and resources.
-
When to use
- Checking if prefetch works.
- Ensuring lazy loading is correctly applied.
 Figure: Network panel waterfall highlighting request timing and caching.
6. Source Maps
-
What it does
- Maps minified/compiled code back to the original source code.
- Enables accurate stack traces and debugging in production.
-
When to use
- Debugging production errors (e.g., via error tracking tools like Sentry).
-
Relation
- Unlike Lighthouse or Profiler (which measure performance), Source Maps are purely for code-level debugging.
Summary
- React DevTools → component-level debugging (props, state, re-renders).
- Profiler (inside React DevTools) → render-time performance analysis.
- Lighthouse → automated page-level performance and quality audit.
- Web Vitals → real-user performance metrics in production.
- Bundle Analyzers → build size optimization.
- Network Panel → request/caching/prefetch debugging.
- Source Maps → map production errors to original source for debugging.